
Our WordPress Admin Took 13 Seconds a Page. Here’s the Audit.
September 20, 2026 0 comments
In this post
- What happened on a Tuesday
- Why is the admin slow when the front end is fine? Where to look, in order
- The 12 MB autoload: a real problem, and the wrong one
- Where the audit stops
- Six PHP-FPM workers: the max_children limit on shared hosting
- WP-Cron and bot 404s were eating the pool
- The last seven seconds
- What we changed
- What a read-only WordPress MCP server is actually for
What happened on a Tuesday
On the 8th of September, macronimous.com’s admin went from sluggish to unusable. Opening Pages took long enough to make coffee. By the Wednesday, visitors were getting Cloudflare’s 524 timeout page on the front end, which means Cloudflare reached our server, asked for the page, and gave up waiting after a hundred seconds. The site has been on the same WordPress install since 2015, it has 54 active plugins (we know), and it shares an InMotion account with our blog, which is a second, separate install with 33 plugins of its own.
We’d published Auditra three weeks earlier, a free, read-only MCP server for WordPress that lets an AI client read a site’s plugin inventory, autoload, cron schedule, database tables and known vulnerabilities. So the obvious move was to point it at our own site and see how far it got. This post is the honest version of that: what it found, where it stopped, and what it took to get the rest of the way.
We’ll warn you now, it runs long, because the interesting part is the sequence of wrong turns and not the final fix.
Why is the admin slow when the front end is fine? Where to look, in order
If you’re here because your own admin is crawling and you’d rather skip the story, this is the order we’d check now, having done it the long way.
- cPanel ? Resource Usage. If CPU and memory are low, faults are zero, and Entry Processes reads 0 while the site is timing out, your PHP workers are running outside your account and you can’t see them. That’s a hosting question, not a plugin question.
- Bypass Cloudflare. Point the domain at the origin IP in your hosts file and hit the login page with
curl. If it hangs direct, Cloudflare is cleared. - Hit a bare
phpinfo.php. If a one-line PHP file hangs, WordPress is cleared too. - Ask the host two things: the PHP-FPM
max_childrenfor your pool, and a one-day count of requests towp-cron.php, 404s, and top user agents. - Read the autoload, cron list, and plugin inventory with a read-only audit (Auditra, WP-CLI, or by hand). Fix what’s obviously wrong, but don’t assume it’s the cause.
- Install Query Monitor, open an admin page, and read the HTTP API Calls tab before anything else. Dead remote calls hide there.
Now the long way.
The 12 MB autoload: a real problem, and the wrong one
The first call was analyze_autoload. Autoloaded options are the rows in wp_options that WordPress pulls out of the database on every single request, admin or not, before a plugin has done anything. A healthy site keeps that under a megabyte. Ours was 12.7 MB across 989 options, and 98% of it was unattributed, which is the tool’s way of saying no active plugin claimed ownership of those rows.
The largest entries were all _transient_string-locator-search-files-N, numbered past 200, at 77 to 90 KB each. String Locator is a search-and-replace plugin we’d used and then deactivated, and it never cleaned up after itself. Every one of those transients had no expiry, and every one of them was autoloaded. We ran one DELETE in phpMyAdmin (206 rows, 0.08 seconds), called analyze_autoload again, and watched the number drop to 730 KB.
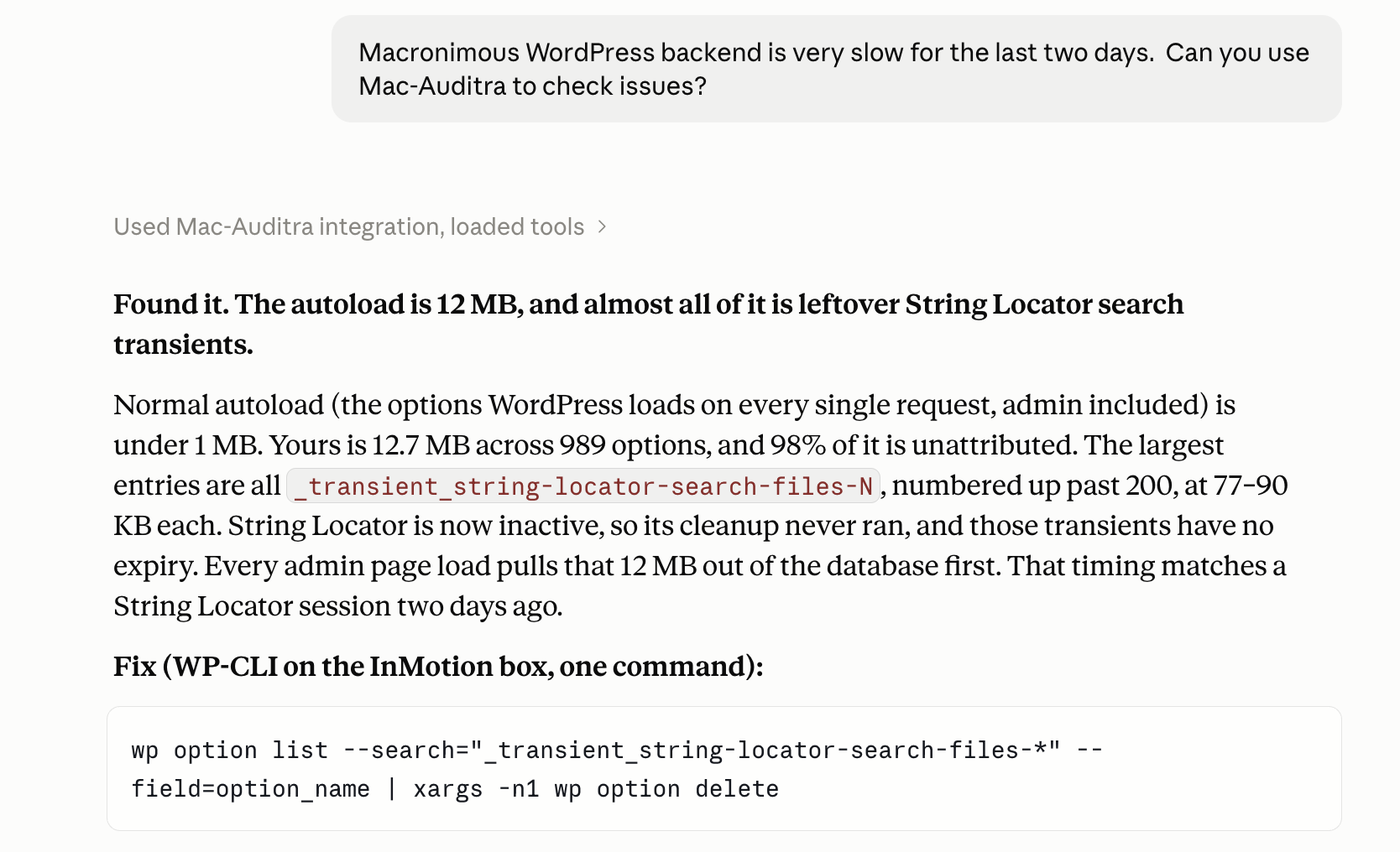
The first response from the model that read the audit opened with “Found it.” We’ve left that line in because it was wrong, and because it’s the most useful wrong answer in the whole story. A 12 MB autoload is a genuine defect that costs every request on the site, and fixing it changed nothing we could feel. The admin was exactly as slow afterwards. So the finding was correct and the diagnosis was not, and that distinction is the whole point of a tool that reports facts instead of verdicts.
Where the audit stops
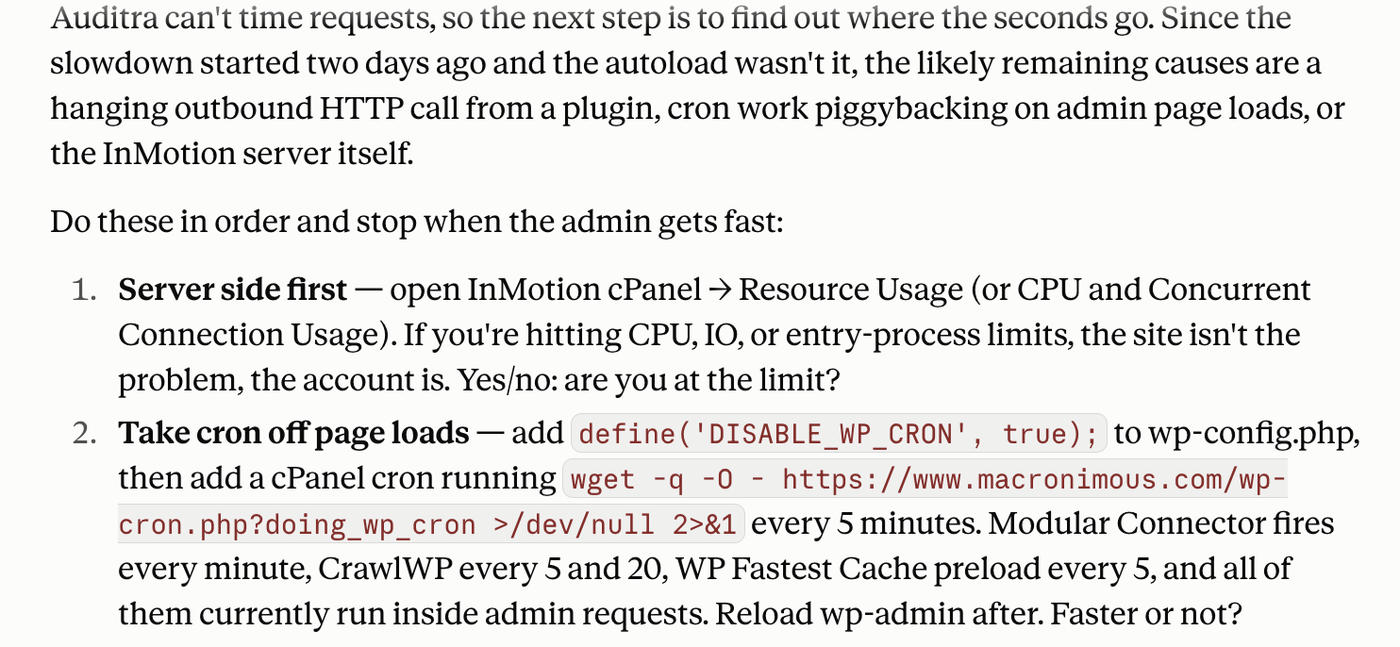
Auditra reads state. It can’t time a request, and it can’t see anything below WordPress. So from here the work moved to things it has no access to: cPanel’s resource graphs, a shell, and the hosting company.
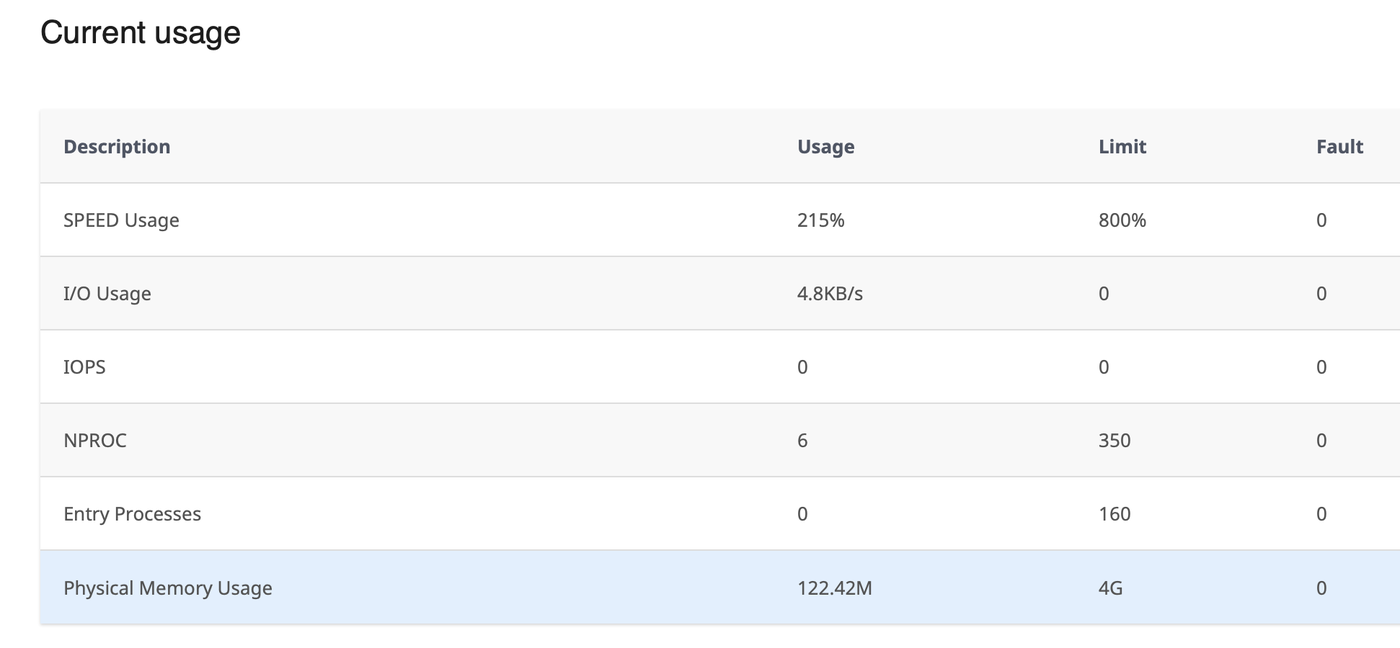
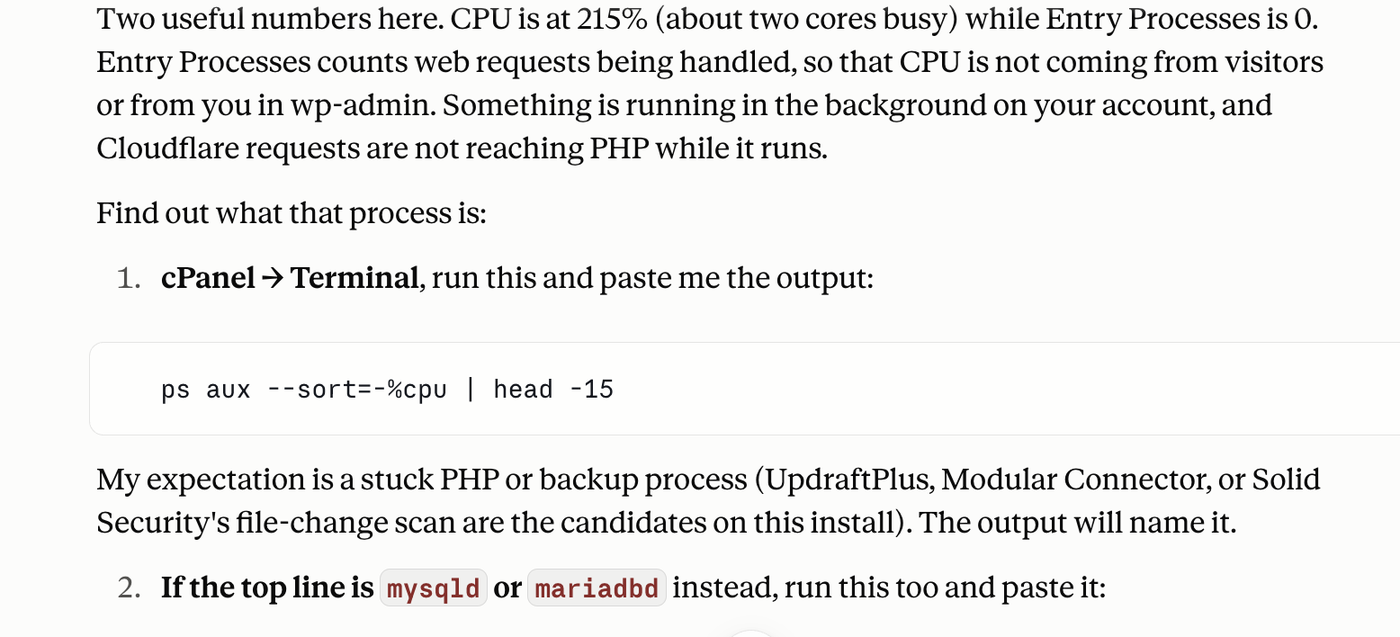
The cPanel numbers made no sense at first. CPU sat at 9 to 15% of the limit, memory under 250 MB of 4 GB, zero faults on every hourly row, and Entry Processes (the count of web requests being handled) at zero while the site was timing out. At one point CPU read 215% with Entry Processes still at zero and six processes total, which is not what a busy website looks like. A ps aux from the cPanel terminal during a hang showed nothing running under our user at all.
To rule out Cloudflare we edited the hosts file on a Mac to point the domain straight at the InMotion IP and ran curl against the origin. The home page came back in 1.4 seconds (a cached file served by WP Fastest Cache from disk, no PHP involved). The login page hung indefinitely. So did phpinfo.php, a one-line file with no WordPress in it. That was the moment the site stopped being the suspect. Nothing in WordPress can make a bare phpinfo() hang.
We read all of that, at the time, as “requests aren’t reaching PHP.” That turned out to be the wrong layer too, and we’ll own it: the requests were inside PHP, in a place we couldn’t see.
Six PHP-FPM workers: the max_children limit on shared hosting
The InMotion engineer (a patient man, by the third hour) found it: the PHP-FPM pool for the account was hitting its max_children limit, and that limit was six. Six PHP processes for a 54-plugin admin, a 33-plugin blog, all their cron jobs, and every bot on the internet. And the number is fixed per plan on shared hosting; it can’t be raised, and there’s no slow log to tell you what’s holding the slots.
In hindsight every odd number fit. The pool runs as a server user outside the cPanel account, which is why ps showed nothing and Entry Processes read zero. The six processes and the 215% CPU on Tuesday were the six workers, all busy. And the front page kept loading because a cached HTML file never asks the pool for anything.
On shared hosting, the number that decides whether your admin works is one you can’t see in WordPress, can’t see in cPanel, and can’t change. Ask your host what it is before you trust any other diagnosis.
WP-Cron and bot 404s were eating the pool
What was filling six slots all day? The same engineer pulled a day of access logs, and this is where the audit’s cron finding from the first hour turned out to matter after all.
| Request type (one day) | Count | Cost |
|---|---|---|
POST /blog/wp-cron.php |
2,086 | Full WordPress load each, one worker held |
POST /wp-cron.php (main site) |
701 | Same |
404s under /blog/ |
6,758 | Uncached, full WordPress load each |
| WP Fastest Cache preload bot | 823 | Our own plugin, hitting our own site |
| AwarioBot + a webmeup scraper | 1,400 | Nothing we wanted |
WordPress has no clock. Its scheduled jobs run when a visitor’s page load notices one is due and spawns an extra request to wp-cron.php. With bots hitting the site a few thousand times a day, that’s a few thousand cron spawns, each one taking a worker for a full WordPress boot. Auditra had listed 65 cron events on the main site, one of them (a management connector we’d installed and never used) firing every minute. We’d noted it as “secondary” on day one. It wasn’t secondary. It was a sixth of the pool, permanently.
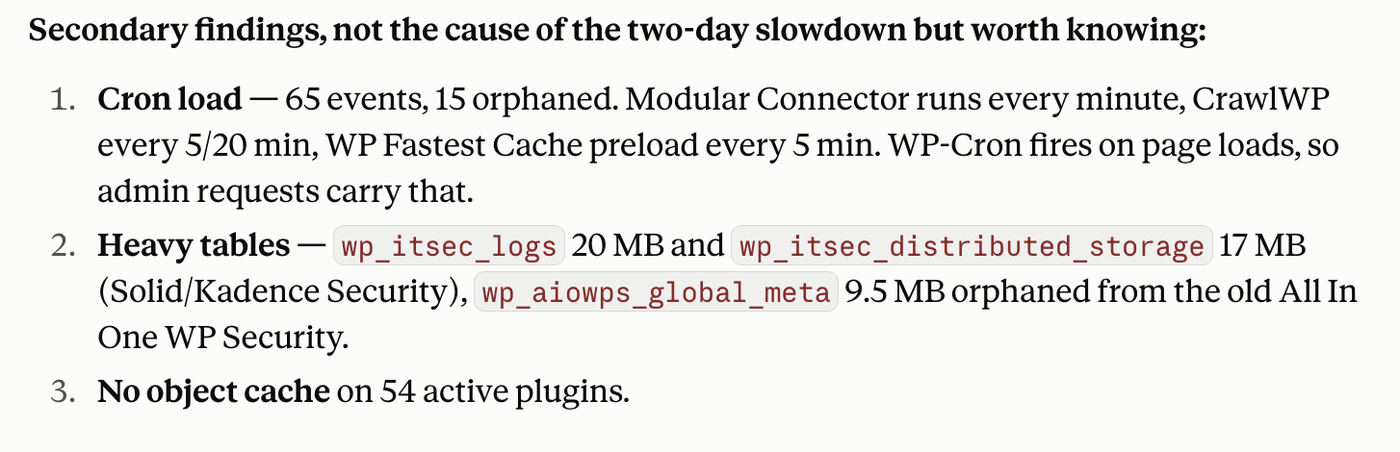
The 404s were ordinary background noise, scanners probing for install.php and fake plugin paths, no single source worth blocking. The problem was only that each one cost a worker, because a 404 page is never cached.
The last seven seconds
After the cron and bot traffic was dealt with (details below), the admin was still slow, and this is where a read-only audit has nothing left to offer. You need something that times a live request. We installed Query Monitor, opened the Pages list, and read the panel: 13.2 seconds page generation, 569 database queries, and an HTTP API tab that told the rest of the story in four lines.
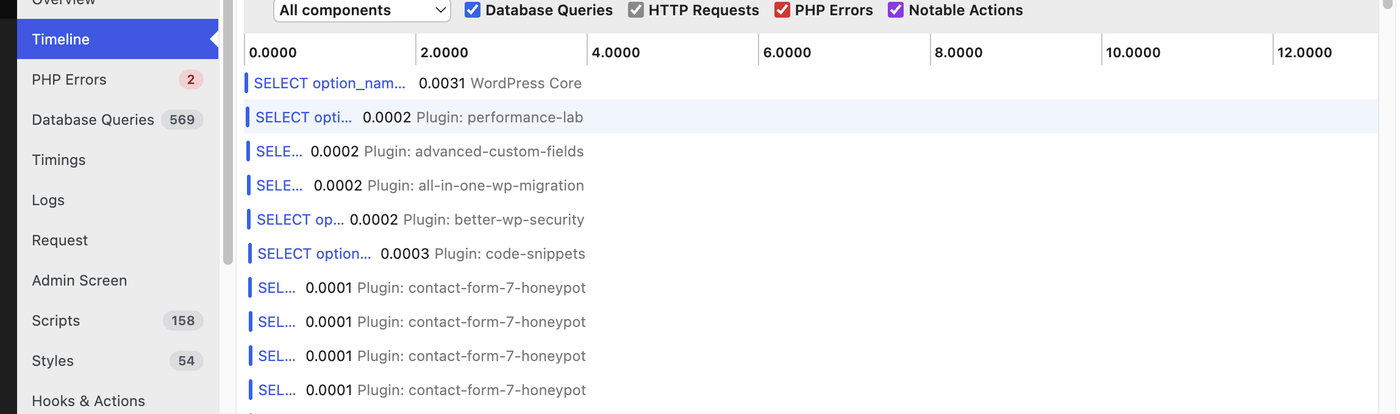
Simple Job Board, which ran our careers page, was calling its vendor’s add-on marketplace on every admin page load to check for updates. That server was stuck in a redirect loop, so each call ran 2.8 seconds before giving up, and it made the call twice. Five and a half seconds per admin page, holding a worker the whole time, for a marketplace we’d never bought anything from. CrawlWP, an indexing plugin, was trying to refresh a Yandex Webmaster token twice per page and getting a 400 each time, another 1.2 seconds, for a search engine none of our clients use.
We deactivated both. Page generation went from 13.2 seconds to 1.37.
Neither plugin was flagged by anything. Both were up to date, both were actively maintained, both had clean vulnerability records. An inventory tool can’t see that a plugin’s phone-home endpoint died last month. Only a profiler watching the request can, and only when you happen to look.
What we changed
For anyone in the same situation, this is the list, in the order we did it. Most of it is in the wp-config reference and Cloudflare’s cache rules docs if you want the full detail.
- Deleted 206 orphaned String Locator transients (12.7 MB autoload to 730 KB)
- Removed the every-minute management connector, and confirmed via
analyze_cronthat it left no orphaned events define('DISABLE_WP_CRON', true);on both installs, with two cPanel server crons at 5 and 15 minutes replacing 2,800 daily visitor-triggered hits with about 380- Cloudflare cache rule: 404 responses under
/blog/cached at the edge for an hour, so repeat scans never reach PHP - Cloudflare WAF rules blocking the two scrapers by user agent, and the usual scanner paths (
install.php,xmlrpc.php,.env) - A physical
robots.txtfor the blog, because WordPress only serves its virtual one at the domain root - WP Fastest Cache preload throttled to 4 pages a minute
- 13 inactive plugins deleted, 8 redundant active ones removed, 2 deactivated (down to about 42 active)
- Simple Job Board and CrawlWP deactivated; the careers page became a paragraph of text
Two things we didn’t fix, for the record. The theme depends on Titan Framework, which has an unfixed medium-severity CVE from 2021 and has been closed on wordpress.org for years; replacing it is a theme rework, not a Tuesday job. And the blog’s 33 plugins haven’t been audited yet. If you’ve read our post on technical debt in old WordPress installs, you already know how this goes: you never finish, you just get to the point where the site stops fighting you.
What a read-only WordPress MCP server is actually for
We built Auditra to be read-only on purpose, and we wrote up why in the plugin security post: no write calls, no scores, facts with thresholds next to them, and the reasoning left to whoever (or whatever) reads the output. This week was the first real test of that split on a site we actually cared about, and here’s our verdict.
It did the first hour and the inventory. Autoload, cron, table sizes, the plugin list with vulnerability flags and content usage, all in a few calls, with none of the clicking through fifty settings screens that a plugin cleanup usually means. And it did the verification: after every change, one call confirmed the cron flag was set, the connector was gone, the server cron had fired. That’s the part people underrate. Knowing a fix took is worth as much as the fix.
It could not diagnose a live hang, and we don’t think a read-only tool should pretend to. That took cPanel graphs, a hosts-file bypass, the host’s view of a pool we couldn’t see, and a profiler timing a real request. Four tools, none of them the audit. If we’d sold Auditra as “finds your performance problem,” it would have failed this week, publicly, on our own site.
So the pitch we’d make to another senior WordPress developer is smaller than the one we started with, and we think it’s the right one. Every site you inherit has a history you can’t see from the admin. A read-only audit reads that history in a minute, in a form an AI client can reason over, and tells you what to rule out first. Ruling out is where the hours go on a bad day. It won’t tell you the pool has six workers. But it’ll get you to the question a lot faster, and it’ll confirm you fixed what you think you fixed.
That’s what we found on our own site. We’d be curious what a ten-year-old install of yours turns up, and if Auditra tells you something you didn’t know, or misses something it should have caught, the comments are open and we’ll add it with credit.
Run the same audit on a site you maintain
Auditra is free, GPL, and read-only. Install it, connect any MCP client, and read your own site’s autoload, cron, tables and plugin history in a few calls. If what comes back is more than you want to deal with, we’ve been cleaning up WordPress installs since 2008.
Related Posts
-
 February 25, 2012
Joomla: A Quick Guide
Joomla! is a free, open source content management system and web application framework that is used to distribute content online or an intranet. Written in PHP, Joomla employs object-oriented programming, software design patterns and uses MySQL as its database program. Joomla’s feature-rich interface includes RSS feeds, blogs, polls, page caching,
CMS, Content Management Systems, Opensource, PHP Programming, web programming9 comments -
 May 22, 2024
Brotli Compression for websites: The Secret Weapon for a Lightning-Fast Website
In web performance, every millisecond counts. A slow website can lead to frustrated users, increased bounce rates, and lost revenue. One often overlooked technique for dramatically improving your site's speed is Brotli compression. What is Brotli Compression? Brotli, developed by Google, is a cutting-edge compression algorithm that squeezes your website's files (HTML, CSS, JavaScript) into much
